Complete Observability for Springboot
SpringBoot Version >=2.4
You need to have a minimum springboot version of over 2.4 to enable the metrics, does not work on 2.1.2.RELEASE
Sample config file to start the OpenTelemetry > Collector and enable Tempo Loki and Prometheus along with Grafana for visualization
to enable the Micrometer Application Observabilty we need to add the springboot actuator and the micrometer registry to our dependencies, here’s the one for maven.
<dependency>
    <groupId>org.springframework.boot</groupId>
    <artifactId>spring-boot-starter-actuator</artifactId>
</dependency>
<dependency>
    <groupId>io.micrometer</groupId>
    <artifactId>micrometer-registry-prometheus</artifactId>
    <scope>runtime</scope>
</dependency>
To enable the application metrics to be collected we need to add the OpenTelemetry Java agent to the application, this can be done by passing the path to the jar file in the application, here’s the Dockerfile for a war application, refer to Application Server Configuration for jar files it is well documented
FROM maven:3-eclipse-temurin-11 as build
WORKDIR /APPLICATION
COPY pom.xml .
RUN mvn dependency:resolve
RUN mvn dependency:resolve-plugins
COPY . .
ARG ENV="development"
RUN echo $ENV
RUN if [ "$ENV" = "production" ] ; then mvn clean install -Pprod.application ; elif [ "$ENV" = "staging" ]; then mvn clean install -Pstaging.application ; else mvn clean install -Pdev.application ; fi
RUN mv /APPLICATION/target/APPLICATION-SNAPSHOT.war /APPLICATION/target/APPLICATION.war
FROM tomcat:9-jdk8-openjdk
RUN wget -O otel.jar  https://github.com/open-telemetry/opentelemetry-java-instrumentation/releases/download/v2.4.0/opentelemetry-javaagent.jar
COPY conf/server.xml /usr/local/tomcat/conf/server.xml # if you have a custom tomcat server file
# CONFIGURABLE
ENV SERVICE_NAME="OPTIMUS"
ENV CLIENT_NAME="EARTH"
ENV INGESTOR_ENDPONT="https://<OPENTELEMETRY-COLLECTOR-HTTP-ENDPOINT>"
# DO NOT EDIT
ENV OTEL_EXPORTER_OTLP_ENDPOINT=$INGESTOR_ENDPONT
ARG ENV="development"
RUN echo $ENV
ENV OTEL_RESOURCE_ATTRIBUTES="service.name=$SERVICE_NAME-${ENV},environment=${ENV},client=$CLIENT_NAME"
ENV OTEL_TRACES_SAMPLER="always_on"
ENV OTEL_INSTRUMENTATION_MICROMETER_ENABLED=true
ENV OTEL_INSTRUMENTATION_COMMON_DB_STATEMENT_SANITIZER_ENABLED=true
ENV OTEL_INSTRUMENTATION_LOGBACK_ENABLED=true
ENV OTEL_METRIC_EXPORT_INTERVAL=10000
ENV OTEL_METRICS_EXEMPLAR_FILTER=ALWAYS_ON
ENV CATALINA_OPTS="-Dhttps.protocols=TLSv1.2"
ENV CATALINA_OPTS="$CATALINA_OPTS -javaagent:otel.jar"COPY --from=build /APPLICATION/target/APPLICATION.war /usr/local/tomcat/webapps
CMD ["catalina.sh", "run"]
This is a multi stage docker build file which attaches the agent during runtime with some default configuration
config files
Transclude of docker-compose.yaml
Transclude of otel-collector.yml
Transclude of tempo.yml
Transclude of loki.yml
Transclude of prometheus.yml
SpringBoot Observerability
Link to original
The above image shows the ideal system design, where we have persistent storage configured, but the one thing which I would like to change is that, make Prometheus a push based receiver than a pull based receiver, I have configured as pull based here for ease of configuration and so that we can get up and running with the usual application defaults.
After we have a default demo application running, we can check if the application metrics are being pulled at the Prometheus Web UI http://localhost:9090 here you can check if all the Micrometer metrics data are being pulled/scraped or not, once this is confirmed we can proceed with the Grafana setup.
Visualization Setup
Access the Grafana instance at http://localhost:3000 the default username and password is admin admin.
Lets add our first data source which is Prometheus from the left pane, the address for the source would be http://prometheus:9090 as we can access the Prometheus container from the docker network and the container address will be resolved by the Docker Network.
After this we would like to visualize the metrics data through a Grafana Dashboard, using the PromQL, but we can use an existing dashboard made by the community for Spring Boot Micrometer Metrics, In the dashboards choose import Dashboard and enter the id 12900 , select the newly added Prometheus data source as the data source. we should now be able to see the application metrics in some really beautiful graphs.
For Tempo Traces, add Tempo as the data source with the URL as http://localhost:3200 after which you can explore all the traces with Tempo Search or TraceQL
For Loki Logging, add Loki as the data source with the URL as http://loki:3100 after which you can explore all the logs with with Loki Search or LogQL
This concludes the basic setup.
Enabling Service Graph and NodeGraph
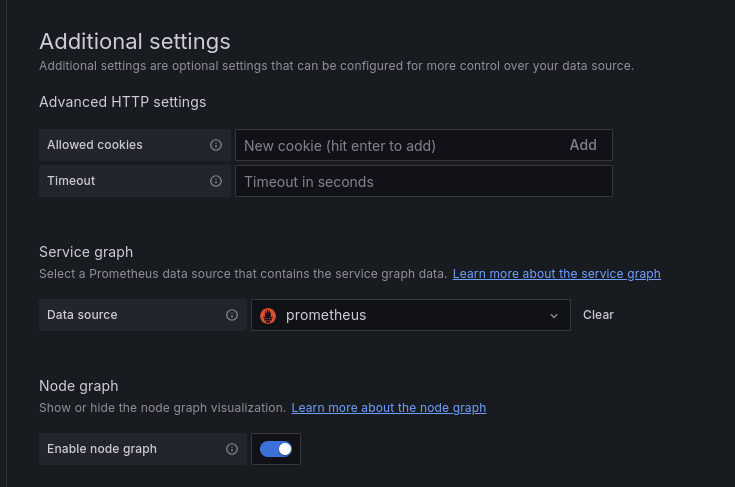
Under Tempo Data source Additional Settings, you can enable the service graph, choose Prometheus as the Data source, we can also enable Node Graph while we are at it.
To use these graphs you need to have spanmetrics enabled tempo metrics generator, which we already have enabled in our tempo configuration file.
Tempo Traces to Metrics
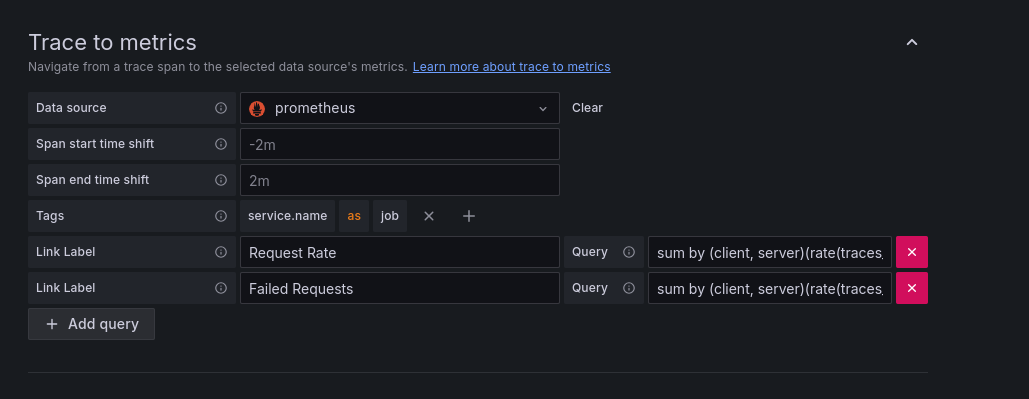
We can also see the metrics for a particular trace by configuring Traces to Metrics in the Tempo Data Source settings, here we can add two basic queries which can be of help.
Under tags add service.name as job
add the following two queries for
- Request Rate -
sum by (client, server)(rate(traces_service_graph_request_total{$__tags}[$__rate_interval])) - Failed Request Rate -
sum by (client, server)(rate(traces_service_graph_request_failed_total{$__tags}[$__rate_interval]))
It should look something like this
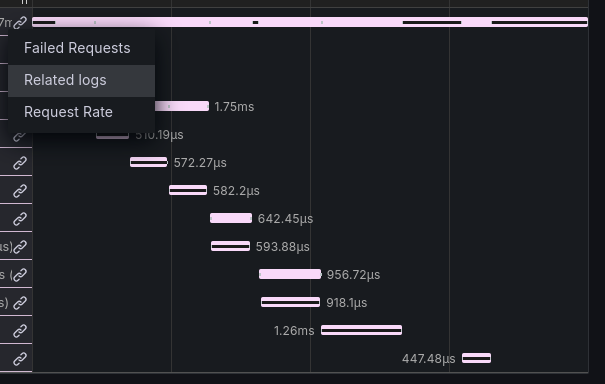
Now when you view a trace you should be able to see a link logo icon, under which you should see the two queries which we have written, clicking on which you can see graph related to that trace, which looks amazing, this is the trace to metrics now let’s look at trace to logs
Tempo Traces to Logs
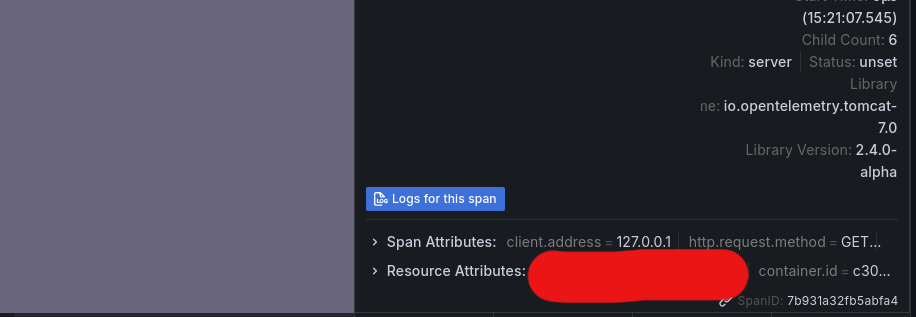
Just above Trace to Metrics you should be able to see Trace to logs, select Loki as the Datasource and under tags just like tempo set service.name as job
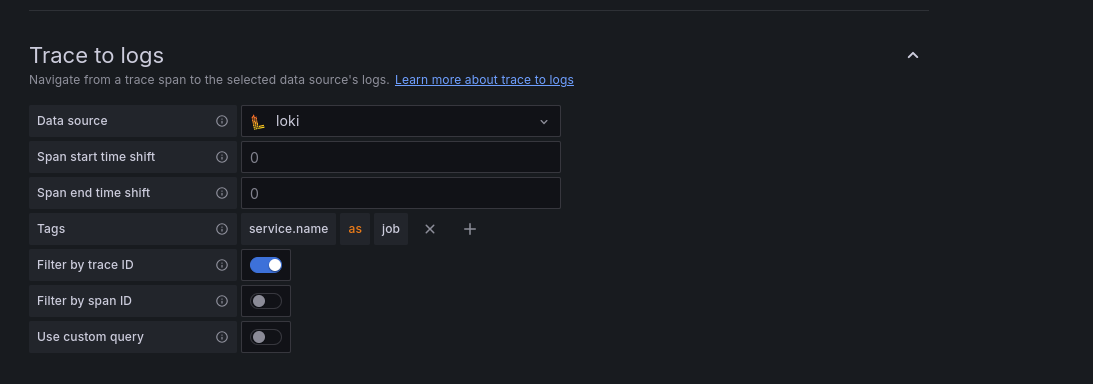
it should look something like this, now on each trace and span you can see the button see related log button you should also be able to see a link under the link icon
Loki Logs to Traces
We have seen that we can go from Tempo Traces to Metrics and Logs, that would be useful when you want to see the logs of the requests that are slower than expected what if, you want to see the request and the flow of a error message which you cant seem to figure out?
Here comes Loki Logs to Tempo Traces
In Loki Datasource settings add a derived field, enable the internal link button choose tempo datasource and add the following
- Name :
Trace ID - Type: Regex in Log Line
- regex:
"traceid"\s*:\s*"([^"]+)" - Query:
${__value.raw} - URL Label:
View Trace
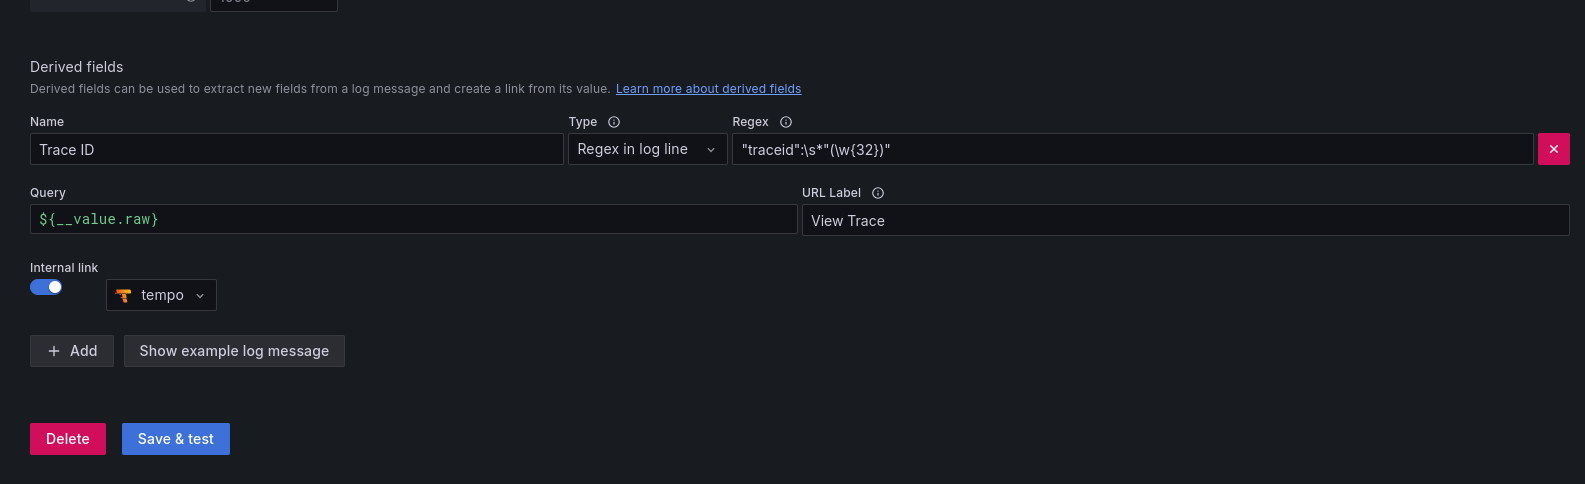
This is the logging view on the Loki Explore page

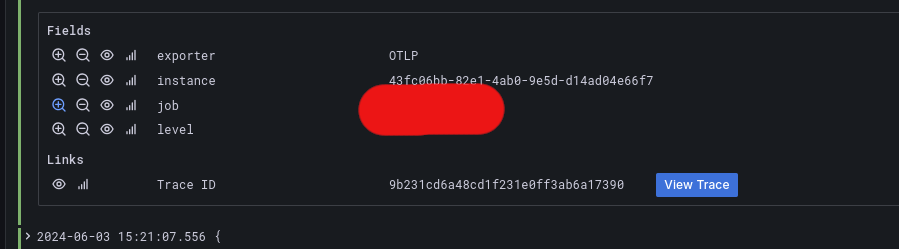
Choose any of the bar and the log from the list, scroll down to find the Fields and Links section to find the following link.
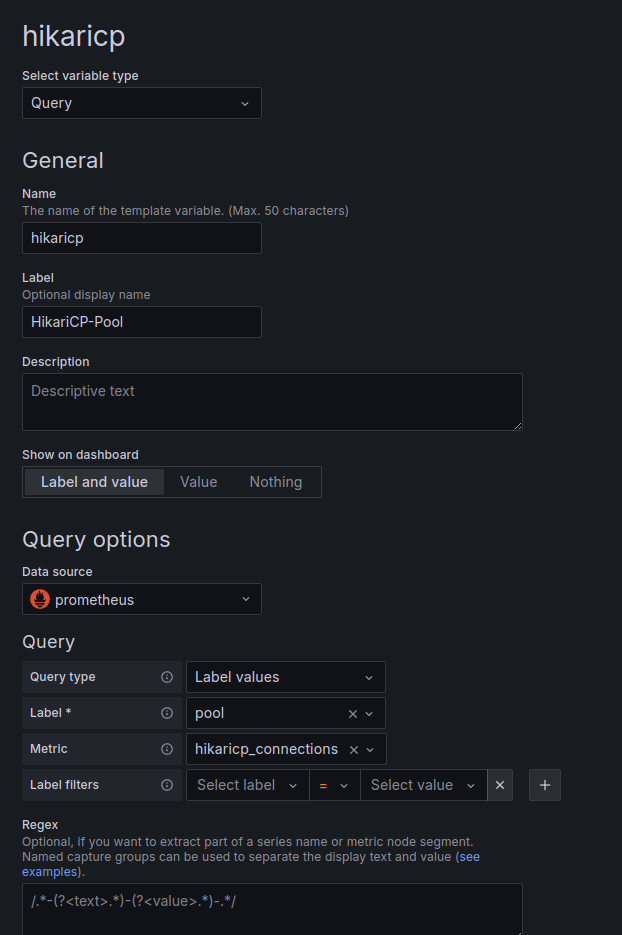
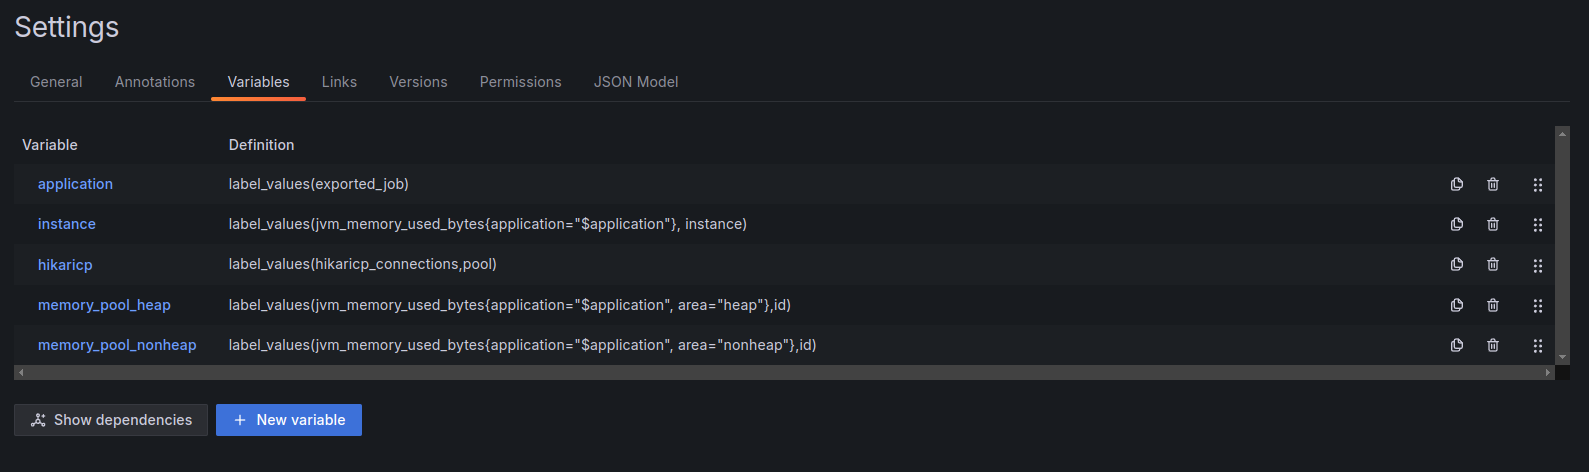
Now we have to configure the dashboard we have to replace application=”…”, instance=”…” and any other occurrence of instance and application should be replaced with exported_job=$application
an example is shown below

this is for the application variable
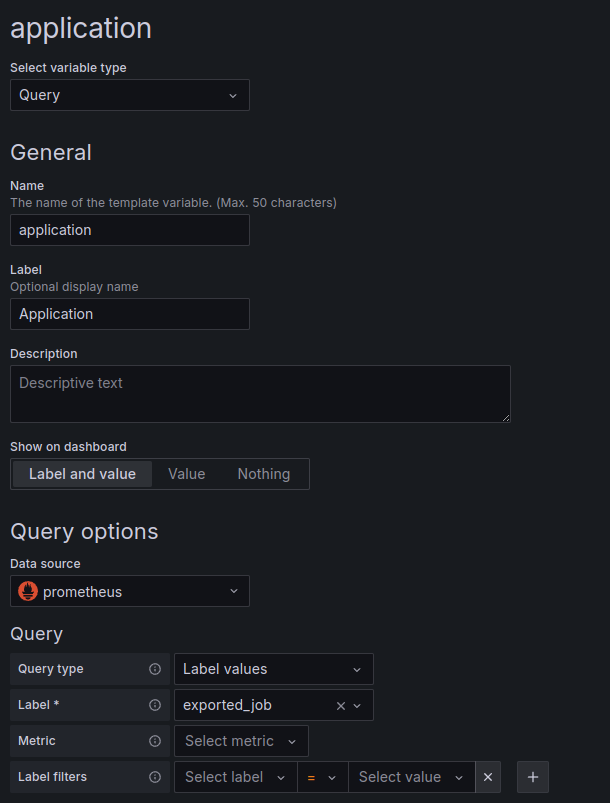
HikariPool variable
summary
you can remove tomcat section for springboot embedded tomcat servers
to enable the node setting you have to enable the service graph in tempo additonal settings and set the prometheus scraping value to 10s